

We compiled these trends from over 100 brands, comparing year-over-year data for the date range August 1, 2026, to August 31, 2026.
August 2026: Consumer Spending Holds Steady Amid Fed Rate Hike
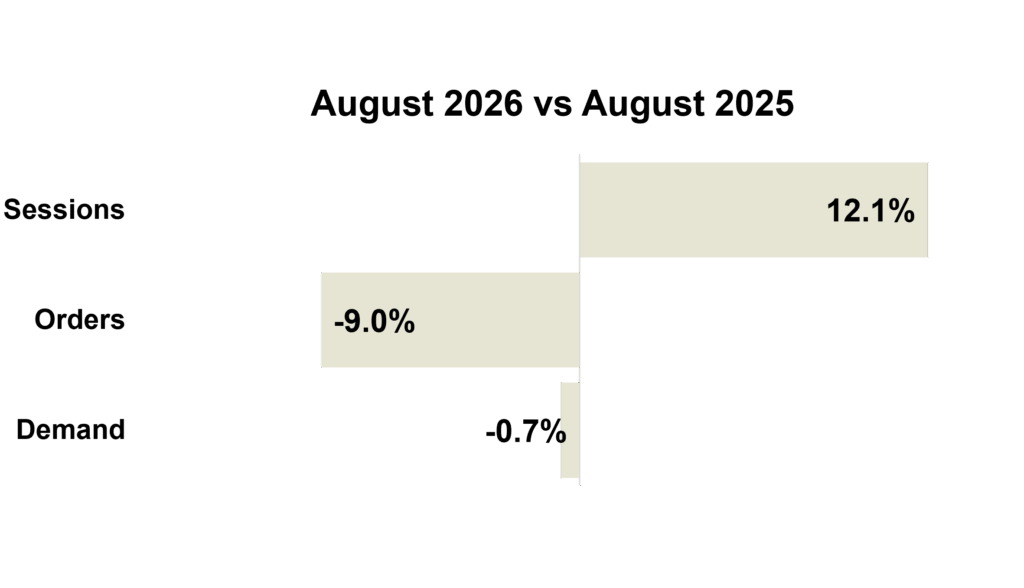
August sessions rose 12.14% year over year, while orders fell 9.01% and demand eased 0.66%, a step back from July after several strong months. With traffic up sharply, the gap likely reflects near-term conversion softness worth monitoring.
The broader retail backdrop remains resilient. Commerce Department data showed retail sales rebounding 1.2% month over month in August and rising 6.0% year over year, reversing July’s Prime Day–related dip. Gains were broad-based across electronics, restaurants, and online sales, a sign that consumers remain engaged and spending.
Inflation ticked up modestly in August. CPI rose 0.4% for the month, driven largely by higher gas prices, while the annual rate held steady at 3.4%. Core inflation (excluding food and energy) cooled to 2.4%, the lowest since March 2021, signaling that underlying price pressure continues to ease. Even so, the firmer headline reading prompted the Federal Reserve to raise its benchmark rate for the first time in three years, reflecting continued vigilance on inflation.
Business conditions remained generally steady. Consumers stayed resilient through August despite higher gas prices, and while the rate increase adds a new variable to monitor, overall spending continues to hold up well.
August 2026 Marketing Trends
Trend #1:
Belonging Is the New Loyalty Program
For years, loyalty strategies have centered on points, discounts, perks, and rewards. While those tactics still have value, many brands are finding that long-term loyalty is driven less by transactions and more by connection.
Today’s consumers want more than a purchase-based relationship. They want to feel recognized, understood, and part of something bigger than the products they buy. As brand communities grow, marketers are shifting from rewarding purchases to fostering participation, advocacy, and a sense of belonging.
Research shows that consumers increasingly feel more connected to brands through online communities than through traditional social media. These spaces let customers interact with the brand and with one another, building deeper relationships around shared interests, values, and experiences. Brands that cultivate these connections often see stronger retention, greater advocacy, and more meaningful engagement.
This shift matters more as acquisition costs remain high and customer attention becomes harder to earn. A discount may drive a purchase, but belonging creates emotional investment. Through ambassador programs, exclusive events, member-only experiences, customer advisory groups, and personalized communications, brands are turning buyers into participants.
For marketers, this marks an evolution in how loyalty is measured. The question is no longer just “How often do customers buy?” but also “How connected do customers feel?” In a marketplace where products can be copied and prices matched, a sense of belonging may be one of the few advantages competitors cannot easily replicate.
Key Takeaways for CMOs:
- Look beyond points and rewards when evaluating loyalty strategy.
- Create opportunities for customers to participate, contribute, and connect.
- Invest in experiences that strengthen emotional relationships with the brand.
- Measure engagement, advocacy, and community participation alongside purchase behavior.
- Build programs that foster belonging, not just transactions.
Trend #2:
Direct Mail Holds Steady in a Noisy Digital Landscape
Direct mail is proving surprisingly resilient in 2026. According to industry benchmarks drawn from national studies of 500 U.S. marketers and 600 U.S. consumers, direct mail continues to deliver stable, predictable performance while many digital channels face greater volatility in cost and effectiveness. More than half of marketers reported improved direct mail results over the past year, and 95% plan to maintain or increase their direct mail investment.
Three trends stand out this year. First, personalization has moved well beyond adding a name to a postcard; marketers now use purchase history and predicted behavior to tailor offers, messaging, and even imagery at scale through variable data printing. Second, mail increasingly serves as a bridge to digital rather than a stand-alone channel: QR codes, personalized URLs, and AR elements turn physical mailers into on-ramps for online engagement, and more than half of mail-prompted purchases now happen online. Third, format innovation is a growing lever: dimensional pieces, textured stock, and unusual folds increase dwell time as mailboxes get busier and standard postcards blend together.
The common driver is digital fatigue. As inboxes, feeds, and AI-generated content add to the noise, a well-timed piece of physical mail cuts through in a way screens increasingly cannot, giving brands a tactile, intentional touchpoint that stands apart from the constant scroll.
Link – 2026 Direct Mail Marketing Benchmark Report – Chief Marketer
5 Trends Shaping Direct Marketing in 2026 – Polaris Direct LLC
Direct Mail Trends to Watch in 2026: What Businesses Should Know | Limelight Direct Mail Marketing
Trend #3:
Your Next Customer Has Never Visited Your Website
Many acquisition strategies rely heavily on retargeting people who have already engaged with a brand through website visits, ad clicks, email signups, or cart activity. While effective for driving conversions, these tactics are limited by the size of the audience already in the brand’s ecosystem. Eventually, growth stalls because marketers keep targeting the same pool of prospects.
True customer acquisition requires expanding beyond current audiences and reaching consumers who have never interacted with the brand. Transactional co-op databases enable this by using actual purchase behavior, rather than browsing behavior, to identify people who look and act like a brand’s best customers. Marketers can target prospects based on characteristics such as purchase frequency, recency, average order value, product interests, income, geography, and competitive buying patterns.
This shifts the question from “Who has interacted with us?” to “Who behaves like our best customers?” Actual purchase behavior is often a stronger predictor of future buying potential than website activity alone.
Direct mail is particularly effective in this role because it reaches high-potential consumers with no prior relationship with the brand. Rather than simply converting existing demand, direct mail prospecting creates new demand and expands the pool of reachable customers.
Jump to Section
Marketing KPIs: August 2026 Trends by Industry
Marketing KPIs: August 2026 Trends by Company Revenue
$100M+ | $15M-$100M | $0-$15M
Marketing KPIs: August 2026 Trends by Industry
Apparel Industry
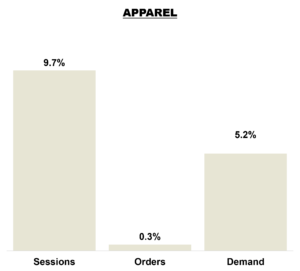 Sessions increased 9.7% year over year, reflecting strong consumer engagement in the Apparel category. Orders were essentially flat (up 0.3%), indicating softer conversion as higher traffic did not translate proportionally into purchases. Revenue grew 5.2%, well ahead of orders, suggesting higher average order values and a favorable product mix. Overall, August results show healthy demand and spending among converting shoppers, though improving conversion remains a key opportunity to capitalize on elevated traffic.
Home Brands
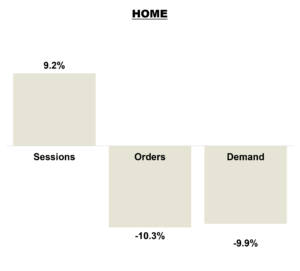
Sessions increased 9.2% year over year, reflecting continued consumer interest in the Home category. However, orders declined 10.3%, indicating significantly weaker conversion as higher traffic did not translate into purchases. Revenue fell 9.9%, largely in line with orders, suggesting stable average order values. Overall, August results show strong engagement but weaker conversion, underscoring the need to improve the shopping experience and better capitalize on elevated traffic.
Outdoor Brands
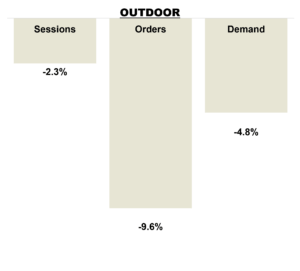
Sessions declined 2.3% year over year, reflecting softer traffic in the Outdoor category. Orders fell 9.6%, indicating weaker conversion and lower purchase activity than last year. Revenue decreased 4.8%, a smaller decline than orders, suggesting higher average order values and a more favorable product mix among converting shoppers. Overall, August results point to softer demand and conversion, though stronger basket values partially offset lower purchase volume.
Specialty Retailers
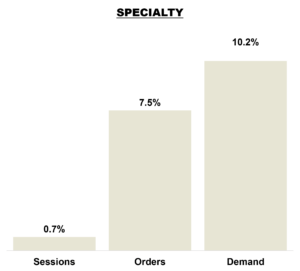
Sessions increased 0.7% year over year, while orders rose 7.5%, reflecting a meaningful improvement in conversion within the Specialty category. Revenue grew 10.2%, outpacing both traffic and orders, indicating higher average order values and a favorable product mix. Overall, August delivered healthy demand and improved monetization, with gains in both conversion and basket size driving solid revenue growth.
Marketing KPIs: August 2026 Trends by Company Revenue
Tier 1 Brands
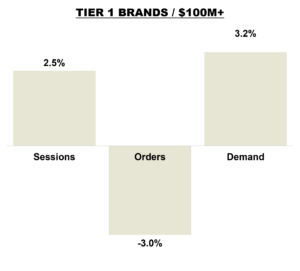
Sessions increased 2.5% year over year for Tier 1 brands, reflecting continued consumer engagement. Orders declined 3.0%, indicating softer conversion as traffic growth did not translate into purchase volume. Revenue grew 3.2%, outperforming both traffic and orders and suggesting higher average order values and a favorable product mix. Overall, August results show resilient spending among converting shoppers, though improving conversion remains a key growth opportunity.
Tier 2 Brands
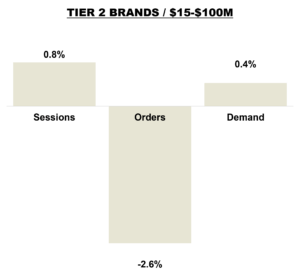
Sessions increased 0.8% year over year for Tier 2 brands, reflecting stable consumer engagement. Orders declined 2.6%, indicating modestly softer conversion, while revenue grew 0.4%, outperforming orders and suggesting higher average order values and a stronger product mix. Overall, August results point to relatively resilient demand and healthy spending among converting shoppers, though improving conversion remains an opportunity for stronger growth.
Tier 3 Brands
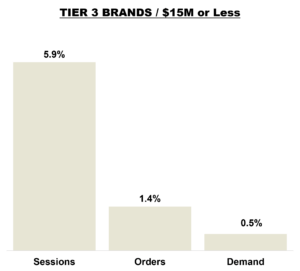 Sessions increased 5.9% year over year for Tier 3 brands, while orders grew 1.4%, reflecting continued consumer interest but slightly softer conversion. Revenue declined 0.5%, indicating modest pressure on average order values and product mix despite positive order growth. Overall, August results suggest smaller brands succeeded in driving traffic and sustaining purchase activity, but lower basket values limited revenue performance.