

We compiled these trends from over 100 brands, comparing year-over-year data for the date range September 1, 2026, to September 30, 2026.
September 2026: Demand Rebounds as Spending Holds Up
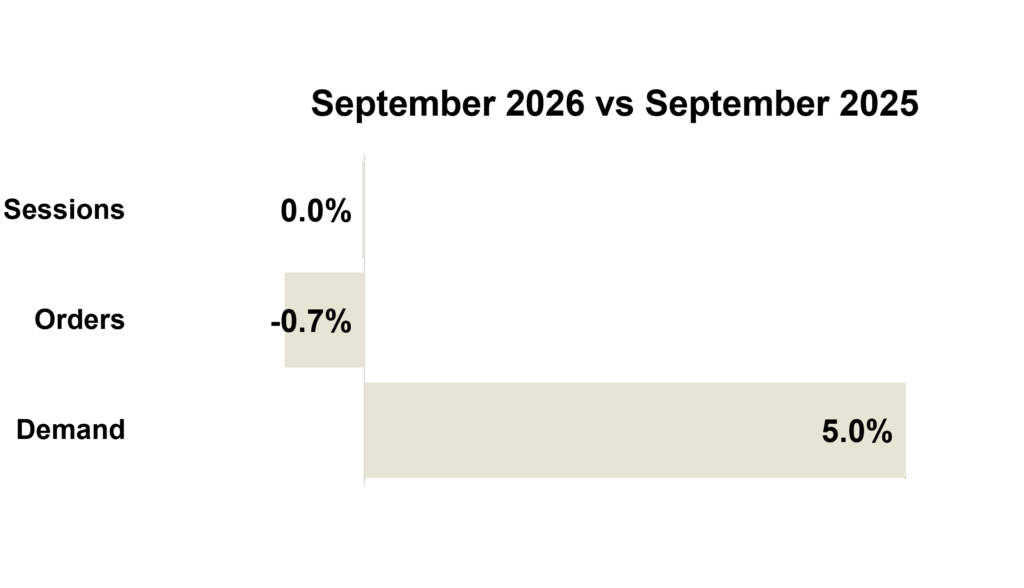
September sessions were flat year over year and orders slipped 0.74%, but demand grew 5.03%, a solid rebound from August’s slight decline. With traffic and orders roughly steady, the demand gain suggests customers are spending more per order.
The broader retail backdrop remains resilient. The latest Commerce Department data (August) showed retail sales rising 1.2% month over month and 6.0% year over year, with gains across electronics, restaurants, and online sales. Consumers remain engaged and spending.
Inflation is mixed but moving in a manageable direction. In August, CPI rose 0.4% for the month on higher gas prices, while the annual rate held at 3.4%. Core inflation (excluding food and energy) cooled to 2.4%, the lowest since March 2021, signaling that underlying price pressure continues to ease. The Federal Reserve raised its benchmark rate for the first time in three years, reflecting continued vigilance on inflation.
Business conditions remained generally steady. Consumers have stayed resilient despite higher gas prices, and while the rate increase adds a new variable to monitor, overall spending continues to hold up well.
September 2026 Marketing Trends
Trend #1:
The Box Is Part of the Brand
For e-commerce brands, the customer experience doesn’t end when someone clicks “purchase.” It ends days later, when the package arrives.
That final moment matters because people don’t remember every part of an experience. They remember the highlights and how it ended. Online, the unboxing is the ending: the first physical interaction a customer has with the brand and one of the few moments they can’t scroll past.
A generic box gets the product there. A thoughtful one reinforces everything the brand has promised along the way. Color, materials, presentation and small surprises can turn a routine delivery into something that feels intentional and rewarding.
The opportunity isn’t simply to make packaging prettier. It’s to make the final touchpoint feel like part of the experience. Because when the box is memorable, the brand is more likely to be, too.
Key Takeaways for CMOs:
- Treat unboxing as part of the customer journey, not a fulfillment detail.
- Make packaging feel consistent with the brand experience that led to the purchase.
- Use thoughtful details to turn delivery into a moment of recognition and reward.
- Look beyond the first sale. Every shipment is another chance to reinforce the relationship.
Trend #2:
Holiday Shopping Starts Earlier in 2026
Holiday e-commerce is headed for another record year. Adobe expects U.S. consumers to spend $275.1 billion online during November and December, up 6.7% from 2025. Increasingly, however, the holiday season isn’t waiting for November.
Adobe projects another $95.8 billion in online spending during October, as promotional events and early discounts pull demand forward. Mobile will continue to play a major role, accounting for an expected 57.4% of holiday e-commerce spending. AI-powered shopping is also gaining ground, with traffic from AI services to retail websites forecast to rise 130% year over year.
For marketers, the message is clear: holiday planning needs to start earlier and work across more touchpoints.
Rather than concentrating investment around Black Friday and Cyber Monday, brands should consider how direct mail, paid media, social, mobile and emerging discovery channels can work together throughout the extended shopping season.
The winners won’t necessarily be the brands with the biggest discounts. They’ll be the ones that build visibility early and stay relevant throughout the customer journey.
Trend #3:
Prime Day: Bigger Total, Smaller Baskets
Prime Day 2026 ran June 23–26 and set a record. U.S. shoppers spent $26.4 billion online across all retailers, up 9.3% year over year, according to Adobe Analytics.
But the baskets got smaller. Numerator found the average Amazon order fell 11% to $47.66, and household spend dropped 8%. Roughly seven in ten items sold for under $20, led by apparel, household essentials and health. It looks more like a stock-up event than a splurge.
It is also no longer Amazon’s alone. Walmart, Target and Best Buy ran overlapping sales; Walmart’s week-long event was open to all shoppers. AI-referred traffic to retail sites rose 235%. On Day 1 it converted 50.7% better than other traffic, a reversal from 2025.
Mobile hit an all-time high for an opening day at 51.2% of sales, and buy now, pay later drove $2.1 billion, up 9.5%. Influencers converted shoppers 11 times better than social overall.
The typical Amazon buyer was a high-income suburban woman aged 45 to 64, and 92% of early shoppers had shopped Prime Day before.
Key Takeaways for Marketers:
- Plan for more orders at lower values; per-order costs do not shrink with the basket.
- Lead with essentials, the categories driving volume.
- Stay visible across retailers, since rivals now run competing events.
- Test product content and data for AI-assisted discovery.
- Invest in mobile checkout, flexible payments and creator partnerships.
Jump to Section
Marketing KPIs: September 2026 Trends by Industry
Marketing KPIs: September 2026 Trends by Company Revenue
$100M+ | $15M-$100M | $0-$15M
Marketing KPIs: September 2026 Trends by Industry
Apparel Industry
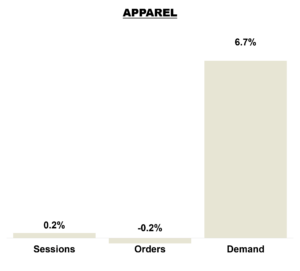 Sessions were essentially flat year over year, increasing 0.2%, while orders declined just 0.2%, reflecting stable traffic and conversion performance in the Apparel category. Revenue grew 6.7%, significantly outpacing both traffic and orders, indicating stronger average order values and a favorable product mix. Overall, September results highlight resilient consumer spending and improved monetization, positioning the category.
Home Brands
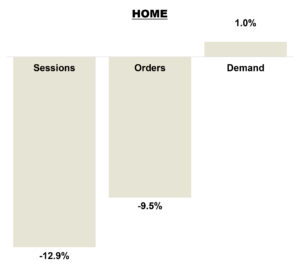
Sessions declined 12.9% year over year in the Home category, while orders fell 9.5%, indicating softer demand but improved conversion efficiency among site visitors. Despite lower traffic and purchase volume, revenue increased 1.0%, significantly outperforming orders and suggesting stronger average order values and a more favorable product mix. Overall, September results highlight resilient consumer spending and improved monetization, helping offset broader traffic weakness as the category heads into the holiday season.
Outdoor Brands
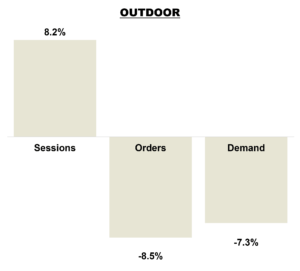
Sessions increased 8.2% year over year, reflecting continued consumer interest in the Outdoor category. Orders declined 8.5%, indicating weaker conversion efficiency as higher traffic levels did not translate into purchases. Revenue fell 7.3%, though it outperformed order volume slightly, suggesting average order values remained relatively stable. Overall, September results highlight strong engagement but softer sales performance, underscoring the need to improve conversion and better capitalize on growing site traffic.
Specialty Retailers
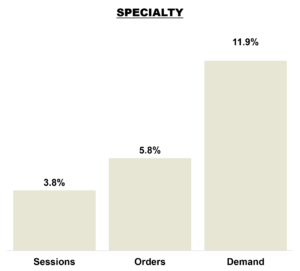 Sessions increased 3.8% year over year, while orders rose 5.8%, indicating improved conversion efficiency in the Specialty category. Revenue grew 11.9%, significantly outpacing both traffic and order growth, reflecting stronger average order values and a favorable product mix. Overall, September delivered broad-based improvement across the funnel, with healthy consumer demand, stronger basket sizes, and improved monetization.
Marketing KPIs: September 2026 Trends by Company Revenue
Tier 1 Brands
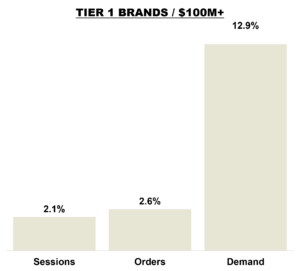
Sessions increased 2.1% year over year for Tier 1 brands, while orders rose 2.6%, reflecting stable demand and modestly improved conversion efficiency. Revenue grew 12.9%, significantly outpacing both traffic and order growth, indicating stronger average order values and a more favorable product mix. Overall, September results highlight healthy consumer spending and improved monetization, positioning Tier 1 brands well as the industry moves into the holiday season.
Tier 2 Brands
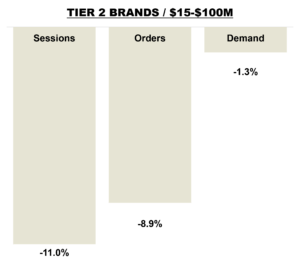
Sessions declined 11.0% year over year for Tier 2 brands, while orders fell 8.9%, indicating softer demand but modestly improved conversion efficiency. Revenue decreased just 1.3%, significantly outperforming both traffic and order trends, suggesting stronger average order values and a favorable product mix. Overall, September results highlight resilient spending among converting shoppers, helping offset lower site traffic and purchase volume.
Tier 3 Brands
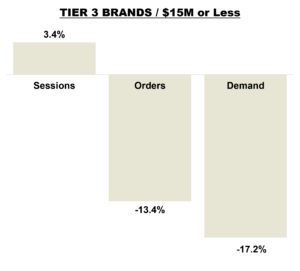 Sessions increased 3.4% year over year for Tier 3 brands, reflecting continued consumer engagement. However, orders declined 13.4%, indicating a significant deterioration in conversion efficiency as higher traffic levels failed to translate into purchases. Revenue fell 17.2%, declining faster than order volume and suggesting additional pressure on average order values and product mix. Overall, September results highlight ongoing challenges for smaller brands in converting demand into sales, with both conversion and basket size weighing on performance.