

We compiled these trends from over 100 brands, comparing year-over-year data for the date range July 1, 2026, to July 31, 2026.
July 2026: Steady Spending, Cooling Inflation
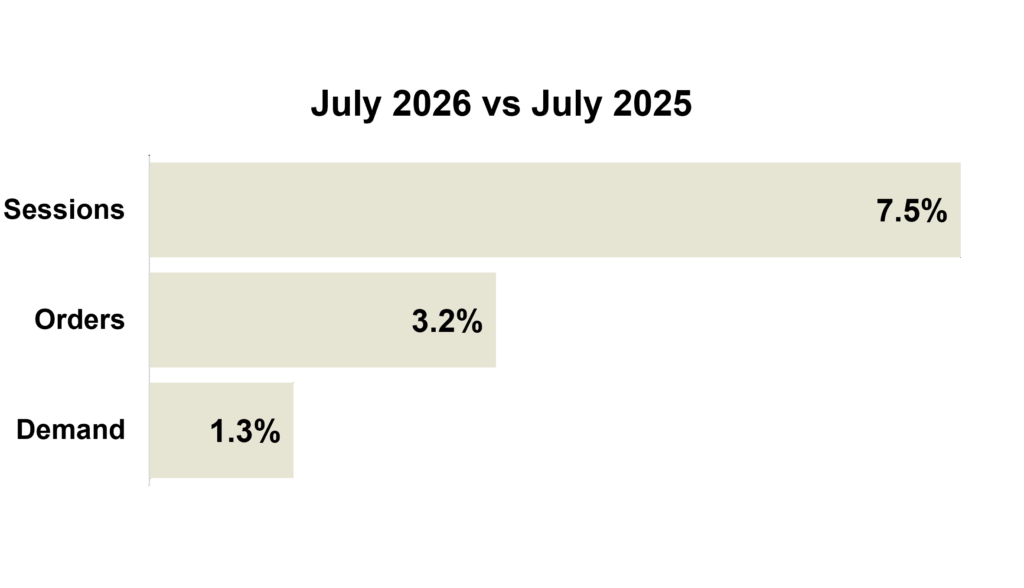
July sessions rose 7.5% and demand grew 1.3% year-over-year. Orders rose 3.2%, reversing June’s 0.5% decline. Consumers stayed value-conscious, but lower energy costs and easing inflation kept supporting spending.
Retail’s softer July headline was mostly a timing story. Amazon shifted Prime Day from July to June 23–26 this year, pulling online and discretionary spending forward into June. July then lapped that pull-forward: online sales fell 2.2%, the steepest drop of any category. Economists attributed the softer headline to this calendar shift rather than weaker underlying demand, which held up well.
Inflation stayed mild month-over-month. CPI rose just 0.1% from June, and the annual rate slipped to 3.4% from 3.5%. Energy fell 1.5%, driven by a 2.9% drop in gas prices, offsetting small gains in shelter and food. Year-over-year, though, the picture is mixed: 3.4% is down from June and from May’s 2026 high near 4.25%, but still above last July’s 2.7% and the Fed’s 2% target. The 2026 trend is improving, even as prices remain elevated versus a year ago.
Business conditions held steady. Census Bureau survey data showed continued positive readings on current performance and demand. Together, the data point to a consumer and business environment cooling from an unusually strong stretch, but still fundamentally resilient.
July 2026 Marketing Trends
Trend #1:
The Rise of Community Marketing
As algorithms become less predictable and AI-generated content floods consumers’ feeds, brands are reevaluating how they build customer relationships. Rather than focusing solely on growing followers or maximizing impressions, many marketers are investing in communities that create deeper engagement, stronger loyalty, and ongoing participation.
Community marketing represents a shift from broadcasting messages to facilitating conversations. According to HubSpot, 40.1% of consumers are more likely to stay loyal to a brand after engaging in an online brand community, while 67% report feeling more connected to brands through community experiences than through social media alone.
These communities can take many forms, including loyalty programs, ambassador networks, customer advisory groups, social communities, educational experiences, exclusive events, and member-only content. While the formats vary, the goal remains the same: creating meaningful interactions between customers and the brand, as well as among customers themselves.
For marketers, the value extends far beyond engagement metrics. Communities often generate stronger advocacy, richer first-party customer insights, more user-generated content, and higher retention rates. As acquisition costs continue to rise, many brands view community-building as a more sustainable way to create long-term growth and differentiation.
The opportunity also extends into physical experiences. Direct mail, exclusive product launches, VIP events, personalized communications, and member-only offers can help strengthen a sense of belonging while creating memorable brand moments that digital channels alone cannot replicate.
For CMOs, the challenge is no longer simply capturing attention. It is creating an environment where customers want to stay, participate, and contribute. In an increasingly crowded marketplace, belonging may become a brand’s most valuable asset.
Key Takeaways for CMOs:
- Shift success metrics from audience size to community participation and engagement.
- Build owned communities that reduce dependence on changing algorithms.
- Leverage community interactions as a source of valuable first-party customer insights.
- Use both digital and physical experiences to strengthen customer loyalty and advocacy.
Read More – https://blog.hubspot.com/marketing/community-marketing
Trend #2:
The Store Experience Remains Luxury’s Competitive Advantage
As digital commerce continues to reshape retail, luxury brands are discovering that their greatest differentiator remains remarkably traditional: the in-store experience. New research from EY found that aspirational luxury consumers overwhelmingly prefer shopping in brand-owned stores, with 71% making purchases through physical retail locations. More importantly, these customers report significantly higher satisfaction with in-store experiences than with luxury brand websites.
The findings highlight a growing challenge for luxury marketers. While brands have invested heavily in e-commerce, many still struggle to translate the emotional, personalized, and service-driven aspects of luxury retail into digital environments. For aspirational consumers—an audience critical to future growth—the appeal goes beyond the product itself. They seek recognition, expert guidance, curated recommendations, and a sense of exclusivity that is difficult to replicate online.
The findings also present an opportunity for marketers to rethink how channels work together. While digital remains critical for convenience and discovery, tactile channels such as direct mail can play an important role in reinforcing the premium retail experience. Exclusive invitations, personalized lookbooks, VIP event mailers, product launches, and curated direct mail pieces can build anticipation before a store visit and extend the relationship afterward. When integrated effectively, direct mail helps translate the exclusivity and personal attention of luxury retail beyond the four walls of the store.
That does not mean digital channels are becoming less important. Instead, leading luxury marketers are rethinking the role of each touchpoint. Digital experiences excel at convenience, personalization, and product discovery, while direct mail and physical retail create deeper emotional engagement. The most successful luxury brands are orchestrating these channels together to create a seamless customer journey that feels personal, exclusive, and memorable from mailbox to storefront
Key Takeaways for CMOs:
- Treat physical retail as a brand-building asset, not simply a sales channel.
- Use personalized direct mail to drive store traffic, VIP events, and exclusive product launches.
- Invest in personalized service, expert guidance, and experiential elements that differentiate in-store visits.
- Design digital, direct mail, and retail experiences to work together rather than compete for attention.
- Prioritize emotional connection and customer recognition across every touchpoint to strengthen long-term loyalty.
Link – https://www.retaildive.com/news/luxury-store-experience-shopping/824578/
Trend #3:
Cut Costs, Not Results: How Smarter Direct Mail Testing Drives Efficiency
In our last post, we talked about protecting what’s working, tightening segmentation, and using this time to test smarter rather than react harder. We also mentioned that the next step is identifying cost-efficiency opportunities that don’t compromise performance.
Because when pressure builds, “cost efficiency” can quickly start to mean broad cuts, smaller budgets, fewer drops, or pulling back circulation faster than the data supports. That may feel decisive in the moment, but in direct mail, the cheapest move is not always the most efficient one.
So where should marketers look first?
1) Start With the Cost Drivers You Can Actually Control
When marketers think about print savings, the first instinct is often to reduce circulation. While that can provide immediate financial relief, it’s usually not the best place to start, at least not with aggressive cuts. In most cases, there are multiple ways to reduce costs before making major changes to circulation levels, including:
- Testing different formats
- Slight reduction in page count
- Paper and production specifications
- Contact strategy and cadence
- Prospecting mix
- Reactivation depth
The goal is not simply to mail less. The goal is to mail more efficiently.
Read more: Cut Costs, Not Results: How Smarter Direct Mail Testing Drives Efficiency
Jump to Section
Marketing KPIs: July 2026 Trends by Industry
Marketing KPIs: July 2026 Trends by Company Revenue
$100M+ | $15M-$100M | $0-$15M
Marketing KPIs: July 2026 Trends by Industry
Apparel Industry
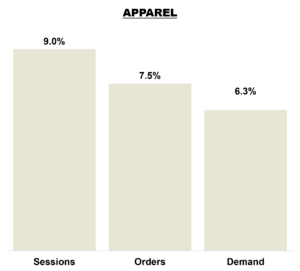 Sessions increased 9.0% year over year, while orders rose 7.5%, reflecting healthy consumer demand and stable conversion performance in the Apparel category. Revenue grew 6.3%, slightly trailing order growth and suggesting modest pressure on average order values. Overall, July delivered balanced growth across the funnel, with strong engagement and sales momentum supporting a positive outlook for the category.
Home Brands
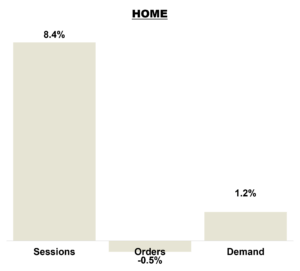
Sessions increased 8.4% year over year, reflecting solid consumer interest in the Home category. Orders were essentially flat at -0.5%, indicating softer conversion efficiency as higher traffic levels did not translate into additional purchases. Revenue grew 1.2%, outperforming orders and suggesting modest improvement in average order values. Overall, July highlights healthy engagement but continued conversion challenges, underscoring the opportunity to better capitalize on growing traffic.
Outdoor Brands
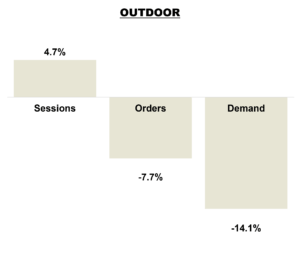
Sessions increased 4.7% year over year, reflecting continued consumer interest in the Outdoor category. However, orders declined 7.7%, indicating weaker conversion efficiency as higher traffic levels did not translate into purchases. Revenue fell 14.1%, declining faster than orders and signaling pressure on average order values and product mix. Overall, July results highlight ongoing challenges in both conversion and basket size, underscoring the need to better monetize site traffic and drive higher-value purchases.
Specialty Retailers
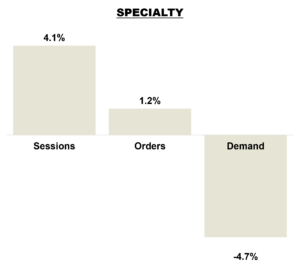
Sessions increased 4.1% year over year, while orders rose 1.2%, reflecting continued consumer engagement and relatively stable demand in the Specialty category. Revenue declined 4.7%, however, indicating pressure on average order values and product mix as shoppers spent less per transaction. Overall, July results suggest that while traffic and purchase activity remained positive, improving basket size and revenue per order will be key opportunities for growth moving forward.
Marketing KPIs: July 2026 Trends by Company Revenue
Tier 1 Brands
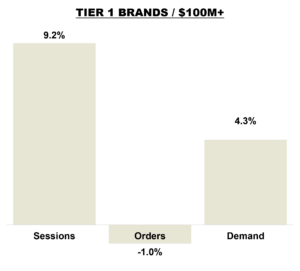
Sessions increased 9.2% year over year for Tier 1 brands, reflecting strong consumer engagement and continued brand visibility. Orders declined 1.0%, indicating softer conversion efficiency as higher traffic levels did not fully translate into purchases. Revenue grew 4.3%, outperforming order volume and suggesting stronger average order values and a more favorable product mix. Overall, July results highlight resilient spending among converting shoppers, though improving conversion remains a key opportunity to maximize the value of increased traffic.
Tier 2 Brands
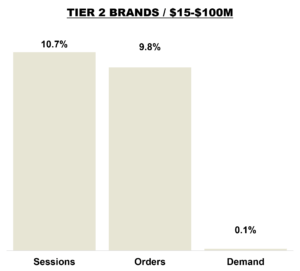
Sessions increased 10.7% year over year for Tier 2 brands, while orders rose 9.8%, reflecting strong demand and stable conversion performance. Revenue was essentially flat at 0.1%, however, indicating significant pressure on average order values and product mix despite higher purchase volume. Overall, July results highlight healthy consumer engagement and order growth, but softer basket economics limited revenue performance.
Tier 3 Brands
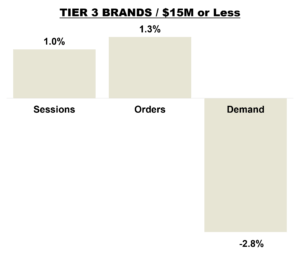 Sessions increased 1.0% year over year for Tier 3 brands, while orders rose 1.3%, reflecting stable demand and slightly improved conversion performance. Revenue declined 2.8%, however, indicating pressure on average order values and product mix despite positive order growth. Overall, July results suggest smaller brands maintained shopper engagement and purchase activity, but lower basket values limited revenue growth.