![]()
We compiled these trends from over 100 brands, comparing year-over-year data for the date range April 1, 2026, to April 30, 2026.
April 2026: Strong Traffic, Continued Resilience
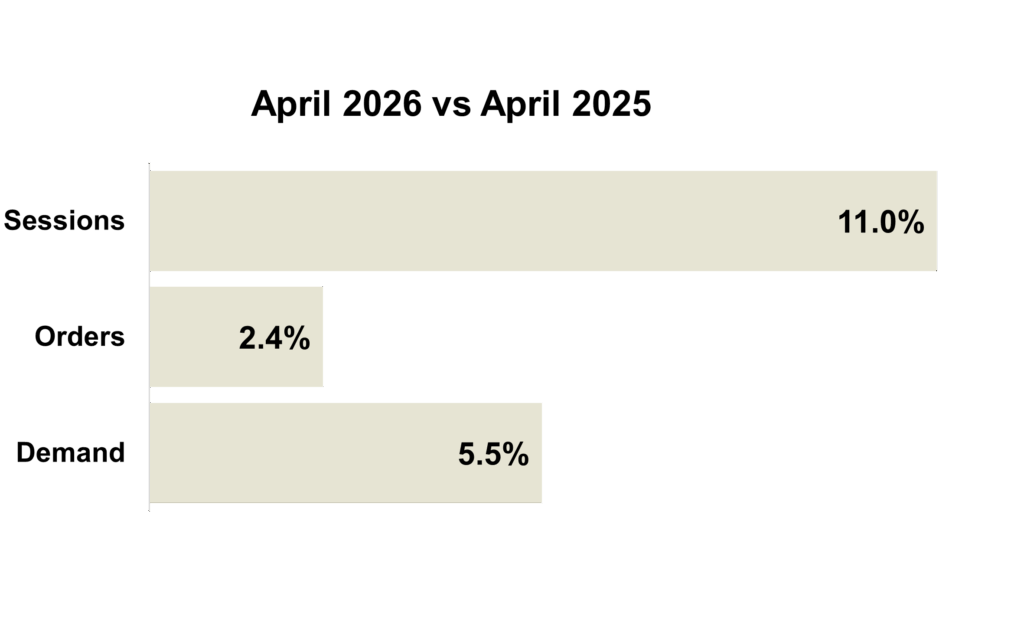
April saw positive growth, despite continued macroeconomic headwinds. Compared to last year, orders and demand were up led by growth in apparel. Despite growth, many brands saw lower conversion rates. However, this was offset by higher average order values.
Conversion rates declined across many brands, reflecting broader trends of increased comparison shopping and longer decision cycles. However, this was offset by higher average order values, as consumers consolidated purchases and spent more per transaction.
Consumers remain highly value focused. While inflation has cooled, prices are still elevated, keeping pressure on spending decisions. At the same time, businesses continue to face margin pressure from higher shipping, input, and operating costs.
The near-term outlook is cautiously positive. Demand remains steady, but growth will likely be uneven as consumers stay selective. Brands that emphasize value, and stay operationally flexible, will be best positioned to capture growth in coming months.
April 2026 Marketing Trends
Trend #1: A Marketer’s Playbook for the July USPS Price Increase
The Postal Services is anticipating their latest price increase this July. The size of the change will vary by mail class, but many Marketing Mail programs could see increases in the 5% to 6.5% range. Overall, the USPS has indicated an average increase of about 4.8%, including a Forever stamp move from $0.78 to $0.82.
With increases on the horizon, these are our top strategies to protect performance and keep costs predictable.
- Reduce weight or optimize format:
Look for “safe” production changes that lower postage without changing the customer experience. Start by reviewing paper weight, trim size, page count, inserts, and poly-bagging. Ask your printer for a weight breakdown by component so you can target the biggest drivers. If you are changing size or packaging, test before rolling out broadly. - Improve distribution strategy:
Postage is heavily influenced by how mail enters the postal network. Explore co-mail to deepen presort discounts and consider drop shipping to place mail closer to its destination. Revisit pallet strategy and entry points to capture available savings and align these moves with delivery-time goals. - Maximize Postal Promotions and Incentives:
Build a promotions calendar and plan creative and production timelines around it. Use incentives that fit your campaign, and stay informed as USPS signals potential new programs, including a possible Direct Mail Discovery promotion. - Mail fewer, better pieces
Tighten targeting, refresh suppression lists, and shift volume toward the highest-performing segments to offset higher unit costs.
Trend #2: Direct Mail’s Inflection Point: Managing Cost Pressure Without Sacrificing Impact
As marketers prepare for the second half of 2026, direct mail is reaching an inflection point. Costs are rising, driven by higher postage costs, fewer USPS promotions and continued inflation in production.
USPS rate increases, effective July 12, 2026, will hit flats and carrier route mail the hardest. Increases are expected across core categories, with the steepest pressure falling on flats and first-class mail. For marketers relying on larger catalogs and other high-impact formats to drive retention and brand storytelling, these increases become more consequential compared to brands using print to drive revenue. With the end of the Catalog Insights Promotion at the end of June, remaining promotions offer only tactical offsets. Net postage costs are likely to rise meaningfully in the back half of the year.
Rising production costs are adding further strain. Paper prices are up, with supply risk in some grades, while ink, freight, and materials remain elevated. For many brands, production costs now rival, or exceed, postage as the primary driver of year-over-year increases.
Leading brands are responding by targeting more precisely, with deepening campaign measurement, and increased focus around lifetime value and incremental contribution. The implication is clear, brands that recognize this inflection point and adapt, will be best positioned in an ever more demanding cost landscape.
Trend #3: Client Advisory: Planning Smartly for Direct Mail In 2nd Half of 2026
Planning Priorities for Q3 and Q4 2026
Reforecast with total cost visibility.
Build budgets that roll together postage, paper, print, and logistics to avoid mid-cycle budget pressure and enable clearer tradeoffs.
Use promotions intentionally.
Leverage USPS programs where they align with experience and measurement goals but assume partial offsets when planning budgets.
Prioritize high-value audiences.
As cost per contact rises, concentrate circulation on customers with proven lifetime value and response potential. Precision outperforms volume as inflation increases.
Optimize execution before reducing presence.
Adjust format, page count, trim size, or cadence before elimination mailings outright. Small execution changes often preserve performance at lower cost.
Strengthen cross-channel measurement.
Ensure direct mail’s incremental contribution is visible within broader attribution frameworks so investment decisions are grounded in performance, not perceptions.
Bottom Line
Q3 and Q4 2026 favors marketers who treat direct mail as a performance channel rather than a fixed expense. While rising costs demand discipline, brans that plan holistically, optimize intentionally, and measure rigorously can continue to unlock strong returns in an even tighter cost environment.
Jump to Section
Marketing KPIs: April 2026 Trends by Industry
Marketing KPIs: April 2026 Trends by Company Revenue
$100M+ | $15M-$100M | $0-$15M
Marketing KPIs: April 2026 Trends by Industry
Apparel Industry
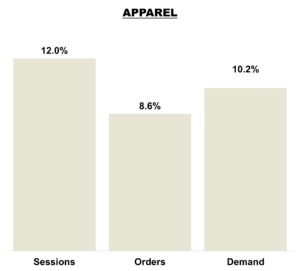 Sessions increased 12% year over year, reflecting strong consumer interest in the Apparel category. Orders rose 8.6%. Revenue grew 10.2%, outpacing order growth and suggesting higher average order values and a healthy product mix. Overall, April highlights strong engagement and basket value, but improving conversion will be critical to fully capitalize on elevated traffic.
Home Brands
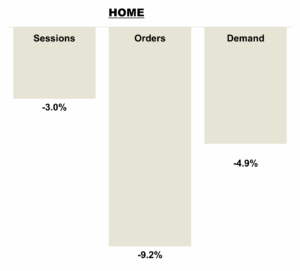 Sessions declined -3% year over year, reflecting softer consumer engagement in the Home category. Orders fell -9.2%, indicating a significant drop in conversion rates. Revenue decreased -4.9%, outperforming orders and suggesting higher average order values among remaining purchasers. Overall, April results highlight pressured demand and conversion, partially offset by stronger basket economics, underscoring the importance of restoring traffic quality and purchase confidence.
Outdoor Brands
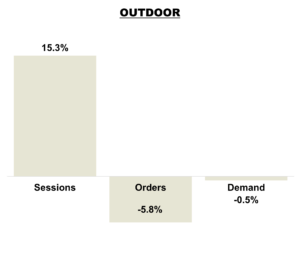 Sessions increased 15.3% year over year, reflecting strong seasonal interest in the Outdoor category. Orders declined -5.8%, indicating weakened conversion efficiency as elevated traffic did not translate into purchases. Revenue fell -0.5%, suggesting higher average order values among converting shoppers. Overall, April highlights robust engagement but continued challenges in converting traffic into sales, pointing to conversion optimization as a critical focus area.
Specialty Retailers
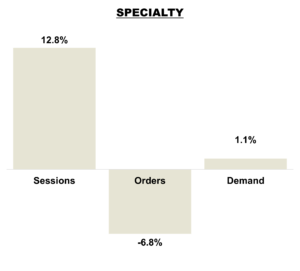 Sessions grew 12.8% year over year, reflecting strong consumer interest in the Specialty category. Orders declined -6.8%, indicating a significant deterioration in conversion efficiency as increased traffic failed to translate into purchases. Revenue grew 1.1%, outperforming orders and suggesting higher average order values among converting shoppers. Overall, April highlights robust engagement but persistent challenges in monetization, underscoring the need to improve conversion while sustaining AOV gains.
Marketing KPIs: April 2026 Trends by Company Revenue
Tier 1 Brands
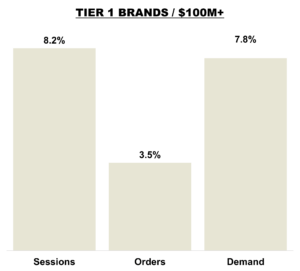 Sessions increased 8.2% year over year for Tier 1 brands, reflecting strong consumer engagement. Orders increased 3.5%. Revenue grew 6.5%, outperforming orders and suggesting higher average order values and a stronger product mix. Overall, April performance highlights robust demand and improving basket economics, with conversion optimization remaining the key opportunity.
Tier 2 Brands
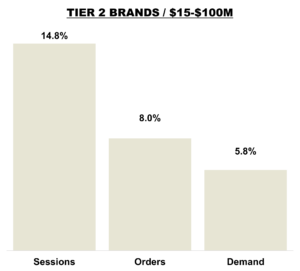 Sessions increased nearly 15% year over year for Tier 2 brands, reflecting strong top‑of‑funnel momentum. Orders grew 8%, trailing traffic and signaling softer conversion efficiency. Revenue rose 5.8%, indicating pressure on average order values and monetization per visit. Overall, April results highlight robust engagement but emphasize the need to improve conversion and revenue efficiency to fully capitalize on elevated traffic.
Tier 3 Brands
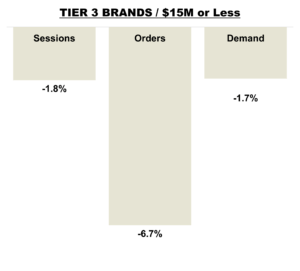 Sessions were down year over year at -1.8% for Tier 3 brands, while orders declined -6.7%, signaling a notable drop in conversion efficiency. Revenue fell -1.7%, outperforming orders slightly and suggesting modest improvement in average order value, but not enough to offset lower purchase volume. Overall, April results highlight ongoing challenges for smaller brands in converting traffic into sales, emphasizing the need to strengthen conversion fundamentals and demand capture.